The Magic of SimpleImputer - finding missing data
- vazquezgz
- Sep 25, 2023
- 5 min read
Updated: Mar 4, 2024
Imagine you're on a quest through a mysterious forest, and you stumble upon a clearing filled with treasures. However, some of these treasures are missing—vanished into thin air! These missing treasures are like the missing data in your dataset. To fill these gaps, you need a reliable spell, and that's where the SimpleImputer comes into play.

What is SimpleImputer?
SimpleImputer is a powerful spell (or function) from the Scikit-Learn library that allows you to handle missing data by imputing (filling in) the missing values with some meaningful information. It's like a magical elixir that replaces the missing data with values derived from the rest of the dataset, ensuring that your dataset remains complete and ready for your machine learning adventures.
How Does SimpleImputer Work?
SimpleImputer works by following these steps:
Select the Imputation Strategy: When you create a SimpleImputer, you specify a strategy to determine how to fill in the missing values. Common strategies include:
'mean': Fills missing values with the mean (average) of the non-missing values in the same column.
'median': Fills missing values with the median (middle value) of the non-missing values in the same column.
'most_frequent': Fills missing values with the most frequent (mode) value in the same column.
Fit the Imputer to Your Data: You apply the fit method of the SimpleImputer to your dataset, teaching it the magical properties of your data. It calculates the mean, median, or most frequent value for each column based on your chosen strategy.
Transform Your Data: Once the SimpleImputer is trained (or fitted), you use the transform method to perform the actual imputation. It goes through your dataset and replaces the missing values in each column with the corresponding calculated value.
Example 1:
import pandas as pd
from sklearn.impute import SimpleImputer

# Load your dataset
data = pd.read_csv('your_dataset.csv')

# Create the SimpleImputer with the 'mean' strategy
imputer = SimpleImputer(strategy='mean')

# Fit the imputer to your dataset, learning the mean values imputer.fit(data[['column_with_missing_data']])

# Now, with the knowledge of means, fill in the missing values data['column_with_missing_data'] = imputer.transform(data[['column_with_missing_data']])
Let's assume you have a dataset with missing values and want to visualize the missing data:
import pandas as pd
import numpy as np
import matplotlib.pyplot as plt

# Create a sample dataset with missing values
data = pd.DataFrame({
    'A': [1, 2, np.nan, 4, 5],
    'B': [1, np.nan, 3, 4, 5],
    'C': [np.nan, 2, 3, 4, np.nan]})

# Visualize missing data using Matplotlib
plt.figure(figsize=(8, 6))
plt.imshow(data.isnull(), cmap='viridis', aspect='auto')
plt.colorbar()
plt.title('Missing Data Before Imputation')
plt.xticks(range(data.shape[1]), data.columns)
plt.show()

In this code, we create a sample dataset with missing values and then use Matplotlib to create a heatmap showing the missing values in the dataset. The missing values are displayed as yellow in the heatmap.
Now, let's use SimpleImputer to fill in the missing values and visualize the dataset after imputation:
from sklearn.impute import SimpleImputer
# Create a SimpleImputer with the 'mean' strategy
imputer = SimpleImputer(strategy='mean')
# Fit and transform the imputer to fill missing values
data_imputed = imputer.fit_transform(data)
# Convert the result back to a DataFrame with column names
data_imputed = pd.DataFrame(data_imputed, columns=data.columns)
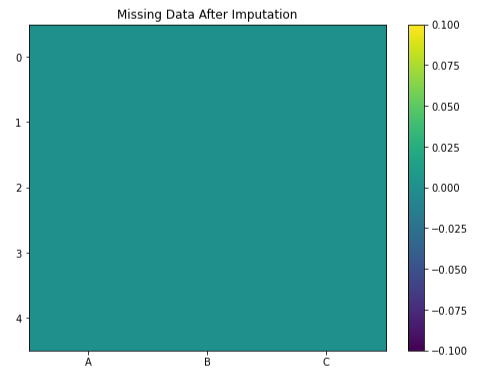
# Visualize missing data after imputation
plt.figure(figsize=(8, 6))
plt.imshow(data_imputed.isnull(), cmap='viridis', aspect='auto')
plt.colorbar()
plt.title('Missing Data After Imputation')
plt.xticks(range(data_imputed.shape[1]), data_imputed.columns)
plt.show()
In this code:
We create a SimpleImputer with the 'mean' strategy to fill missing values with column-wise means.
We use the fit_transform method to fill in the missing values in the dataset.
We convert the result back to a DataFrame with the same column names.
We visualize the dataset after imputation using Matplotlib.
Now, you'll see the second heatmap that shows the dataset after imputation, with the missing values replaced by their respective column means. This demonstrates how SimpleImputer can be used to handle missing data, and Matplotlib helps visualize the impact of imputation. In this example, the SimpleImputer first calculates the mean of the column_with_missing_data using the fit method. Then, the transform method applies this mean value to fill in the missing data. Voila! You've successfully recovered the lost treasures in your dataset and made it ready for your machine learning endeavors.
Here are some other scenarios where you can apply SimpleImputer:
Time Series Data:
Time series datasets often have missing values due to irregular data collection intervals or sensor failures. SimpleImputer can be used to fill in missing values with techniques like forward-fill or backward-fill to propagate the last known value forward or backward in time.
Finance and Economics:
Financial and economic datasets may contain missing values in stock prices, economic indicators, or financial reports. SimpleImputer can help by replacing missing values with the most recent available value, which is a common practice in such domains.
Healthcare and Medical Data:
In healthcare, patient records and medical data often have missing values due to various reasons. SimpleImputer can be used to replace missing values with statistical measures like the mean, median, or mode of similar patient data.
Natural Language Processing (NLP):
Text data used in NLP tasks may have missing values, especially in large datasets or during data preprocessing. SimpleImputer can be used to replace missing values in text data with placeholders or other suitable values to maintain data consistency.
Geospatial Data:
Geospatial datasets, such as geographic coordinates or environmental sensor readings, can have missing values due to equipment malfunctions or communication issues. SimpleImputer can fill in missing geospatial data using interpolation or other geospatial techniques.
Image Processing:
In image processing, datasets may contain missing pixels or regions in images due to noise or image acquisition issues. While not a direct application, SimpleImputer can be used in data preprocessing to handle missing information in image-related features.
Customer Relationship Management (CRM):
CRM databases may have missing customer data fields, like phone numbers or email addresses. SimpleImputer can help in filling these gaps using information from other sources or inferred data.
Social Sciences Research:
Surveys and social sciences data often have missing responses or demographic information. SimpleImputer can replace missing values with plausible estimates, reducing the impact of missing data on research outcomes.
Environmental Studies:
Environmental datasets may have missing values for weather parameters, pollutant levels, or ecological measurements. SimpleImputer can be applied to estimate missing environmental data based on historical trends or spatial correlations.
Quality Control and Manufacturing:
In manufacturing processes, sensor data may contain missing values due to sensor failures or measurement errors. SimpleImputer can help by filling in missing values with averages or expected values, ensuring quality control.
In these and many other domains, SimpleImputer serves as a valuable tool for managing missing data, improving the integrity of your datasets, and enabling more robust machine learning and data analysis. In our data-driven adventures, we've discovered a powerful ally in the realm of data preprocessing - the SimpleImputer! This enchanting tool equips us with three remarkable imputation strategies to conquer missing data:
Mean Imputation: By filling gaps with the grand average, we create a dataset that's robust and ready for analysis.
Median Magic: When outliers threaten to disrupt our quest, the median imputation steps in, ensuring our data remains resilient.
Mode Mastery: In categorical realms, where numbers falter, the mode reigns supreme, preserving the essence of our categorical treasures.
But what makes SimpleImputer truly magical is its simplicity. With just a few lines of Python, we breathe life into incomplete datasets, transforming them into powerful tools for our machine learning endeavors. Whether you're a novice or a seasoned wizard, SimpleImputer is your trusty companion, making missing data a problem of the past.
Further Exploration:
For those eager to delve deeper into the mystic arts of SimpleImputer and Scikit-Learn's offerings, the official Scikit-Learn documentation is your treasure map:
There, you'll find incantations, spellbooks, and the secrets to mastering this invaluable tool. It's the gateway to a world of knowledge, waiting to be explored.
So, arm yourselves with SimpleImputer, let your data adventures continue, and may your datasets always be complete and powerful!
Comments